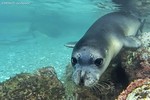
New paper on monk seal recovery in Greece
Thrilled to see our work on Mediterranean monk seal out in @AnimalConserv 🦭
We show a significant range recovery of the species in Greece 🇬🇷 using #CitizenScience & occupancy modelshttps://t.co/ILYdzArZq7
Check out NGO MOm amazing work https://t.co/hM8BhfRQ7w
DM ➡️ PDF 😉 pic.twitter.com/ILqnFvMypL
Career advice to Early Career Researchers
I'm always reluctant to give career advice, cause what worked for me won't work for others, and there is obviously a survivorship bias.
For what it's worth, my 10 pieces of advice to early career researchers in statistical ecology #ISEC2022
🙏 @BayesRuth for the Q 😉
🧵👇 https://t.co/JJEHFFOAc9

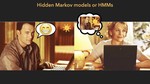
My plenary talk at ISEC2022 on Statistical ecology, hidden Markov models and large carnivores.
Statistical ecology 🌍📊, hidden Markov models 🛰️ and large carnivores 🐺😺🐻 Soooo happy to share our research in this plenary talk at #ISEC2022 @ISEC_stats_ecol 🤩🍾
— Olivier Gimenez 🖖 (@oaggimenez) June 28, 2022
slides and text: https://t.co/BOtZHWU56L
video: https://t.co/6Qn7i05uae pic.twitter.com/vrSYeo9HYF
Reproducible research and GitHub
Yesterday I created my 200th repo on @github 😇 It's been quite an adventure to twist my old habits & switch to #ReproducibleResearch but it's definitely worth it 🤯
Plenty of help out there like @living_norway 🤩 If useful, I also have a 1-day workshop https://t.co/7I6rU61nEg pic.twitter.com/cGDjaA6iTv
A proposal for a diamond Open Access journal in Statistical Ecology
Check it out, this is huge 🤯 Awesome initiative led by @FredBarraquand Let's get ourselves a 💎 #OpenAccess journal in #StatisticalEcology 🤩 Free for readers and for authors https://t.co/HmDhrCLsaN https://t.co/AI7Jjunoek pic.twitter.com/Aywk2ucusQ
— Olivier Gimenez 🖖 (@oaggimenez) June 8, 2022

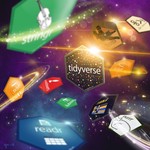
Tips and tricks in Tidyverse
Because of my old age I guess, I'm often asked how I switched from base R #RStats to #tidyverse. I learnt by watching @drob screencasts 🎥 in which he analyses #TidyTuesday data he has never seen before (!). Here is a list of my tips https://t.co/VFAaDz8onE in case it's useful. pic.twitter.com/4Emq2J2qQL
Semaine écologie environnement biodiversité du CNRS à Montpellier
A Montpellier, @oaggimenez présente le fonctionnement du DIPEE Occitanie-Est qui rassemble plusieurs laboratoires @UmrAmap @cefemontpellier @criobe_pf @isemevol @umrMARBEC @MIVEGEC @ihpe_lab @EcotronCNRS
— L'écologie au CNRS (@INEE_CNRS) May 31, 2022
Pour en savoir plus sur ce DIPEE 👇https://t.co/QvGniMkjg2 pic.twitter.com/7ekUx3vwu5

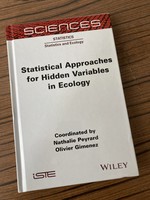
Our new book on statistical approaches for hiddens variables in ecology
It's real 😇🤩🥳 https://t.co/HdWol2H6PJ pic.twitter.com/NUSXtS1fQy
— Olivier Gimenez 🖖 (@oaggimenez) May 24, 2022
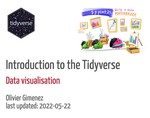
My quick introduction to data visualisation with R
🔧🚧 I have updated my quick introduction to data visualisation w/ R 📦 ggplot2 🥳
— Olivier Gimenez 🖖 (@oaggimenez) May 23, 2022
In case it's useful 😉▶️ https://t.co/IWNesVjwqq ◀️
w/ practicals https://t.co/YYkykGeWf1 & solutions https://t.co/NCQYsw8QCg
Cartoons @allison_horst 💜#ggplot #tidyverse #dataviz #RStats pic.twitter.com/RlXFT9F0Tw
Introduction on data wrangling with R
🔧🚧 Intro on data wrangling w/ R 📦 dplyr - import data, pipe, pivot, join, filter, count, work w/ columns, dates, char, factors, etc #tidyverse
— Olivier Gimenez 🖖 (@oaggimenez) May 17, 2022
▶️ https://t.co/Vs2TbYhbBj ◀️
w/ practicals https://t.co/9ktKPp9wfW & solutions https://t.co/YPwibL2w31
Cartoons @allison_horst 💜 pic.twitter.com/ZMSfxYFKWq