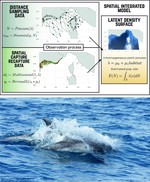
Integrating distance sampling and spatial capture-recapture to assess density of bottlenose dolphins
Check it out 😉🥳 https://t.co/mqyuMSm8QF
— Olivier Gimenez 🖖🦦 (@oaggimenez) September 22, 2022
Resources on finding images and icons
Looking for free images or icons for your talk, website, video, etc. A few pointers that I find useful 😉https://t.co/oTioaam8Y1https://t.co/pueZRTCONFhttps://t.co/nhx3wlPHhvhttps://t.co/6XT1z2jgg5https://t.co/2KCJU3xCAPhttps://t.co/QGnYaLsSjmhttps://t.co/TVlAtmlVDz pic.twitter.com/SoUshEWAgM
— Olivier Gimenez 🖖🦦 (@oaggimenez) August 18, 2022
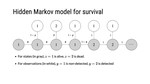
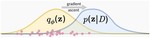
Resources on neural networks for ecology
How do neural networks work 🤔 What's under the hood 🤯 A few pointers in the thread below with a R/statistian bias 😇 #MachineLearning #DeepLearning #NeuralNetworks #CNN #RStats
— Olivier Gimenez 🖖🦦 (@oaggimenez) August 8, 2022
🧵⬇️ pic.twitter.com/4QF1vKoFc8
Writing tips
I’m writing a lot over summer. Writing does not come easily to me. Experience helps of course, but I find it useful to follow some rules, like how to write an intro. Fortunately, the best writing tips are out there 😉
My fav 🧵👇@OpenAcademics#AcademicTwitter#AcademicChatter pic.twitter.com/v2CeZKF6jx
Conseils pour écrire sa thèse
C'est la période de rédaction de thèse pour bcp de jeunes chercheuses/chercheurs. Une étape pas facile à passer. Un fil sur comment on s'y prend dans l'équipe. Ça vaut ce que ça vaut, c'est pas original, mais si ça peut aider, tant mieux.
Et vous, quels sont vos conseils?
🧵⬇️ pic.twitter.com/p8qw4ZoDuQ
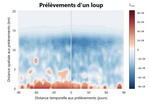
Nos travaux sur le loup
Notre équipe @twitthair1 travaille bcp sur les questions en lien avec la gestion du loup en France 🐺🇫🇷 Voici qqs pointeurs sur nos travaux, en privilégiant les productions en français. Plusieurs de ces résultats ont été obtenus avec les collègues @OFBiodiversite
🧵⬇️
R2ucare back on CRAN
If you need to test the goodness-of-fit of your open capture-recapture models, good news, our #RStats R2ucare is back on CRAN thanks to the amazing work of Murray Efford and @bc_stevenson 🙏🤩
website: https://t.co/SbGrQm9XS2
paper: https://t.co/W38nqsEHPa pic.twitter.com/KelIzsB8Xf
Save the data: EURING2023 in Montpellier April 17-21
🥳 Save the date 🥳
The 2023 Euring Analytical Conference will be held in Montpellier (France), on April 17-21, 2023.
Check out https://t.co/t04XJGbW8k for info.
🤗🤩We look forward to welcoming you all 🤗🤩@_EURING @abesnardEPHE pic.twitter.com/KAe46wOaze

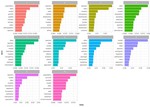
Quick and dirty text mining analysis of ISEC2022 abstracts
Quick & dirty text mining analysis of #ISEC2022 abstracts using topic modelling. Nothing out of the ordinary.
Would be curious to assess time trends in topics w/ longitudinal analysis @chrissuthy 😇😉
Data and code: https://t.co/E2x7avw0E1
Paper: https://t.co/l3ChAIa6Vi pic.twitter.com/NUF1FGm3Lv
Workshop at ISEC2022 on capture-recapture HMMs and Nimble
Would you like to get the most out of your capture-recapture data?
— Olivier Gimenez 🖖 (@oaggimenez) July 1, 2022
We run a workshop on multisite/state/event HMMs models in #Rstats Nimble w/ Daniel Turek @R_nimble at #ISEC2022 @ISEC_stats_ecol
Website w/ slides & codes: https://t.co/gI1ccZO3O9
Video: https://t.co/zA6nh6Ttih pic.twitter.com/ejyE2tCw5o