Interactive visualisation of bias in occupancy models
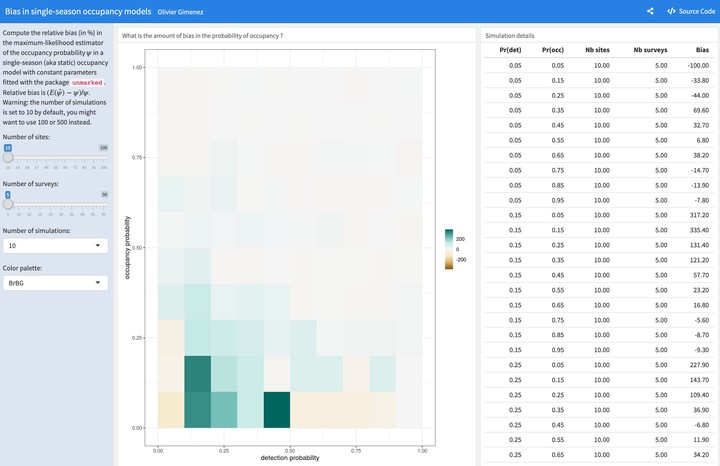
Interactive data visualisation of bias in occupancy models w/ flexdashboard.
Interactive #dataviz of bias in occupancy models w/ #flexdashboard (aka #shinyapps for the rest of us) https://t.co/fkYiHfAaEU #rstats @rstudio #unmarked https://t.co/KKGTPE8eJh pic.twitter.com/Rstpdv8CqJ
— Olivier Gimenez 🖖 (@oaggimenez) April 27,020